Location Tracking — From Phone GPS to Interactive Map
Send your Android phone's GPS to your automation workflow, log it to Google Sheets, and visualize routes on an interactive web map — no server required.
How does location tracking work?
Four pieces, working together: your phone collects GPS, an automation workflow parses each event, Google Sheets stores the log, and the FlowTrigger web map reads the published Sheet. No backend to build or host.
Live Route Mapping
Whether you're tracking field agents, monitoring delivery vehicles, or just logging your own path, FlowTrigger pushes your location directly to your workflows. Transform static spreadsheets into dynamic visual maps automatically.
Mobile App
FlowTrigger sends precise GPS coordinates from your device.
Automation
n8n, Make, or Zapier catches the data payload instantly.
Google Sheets
Coordinates and timestamps are logged as a new row.
Web Map
Coordinates are plotted to visualize the live route.
Step 1 — Copy the Google Sheets template
Copy the ready-made Google Sheets template — it has every column the FlowTrigger app writes and the web map reads. Save it to your Drive, then publish it as CSV so the map can fetch it.
Google Sheets template
Public template with the exact column headers FlowTrigger writes and the web map reads. Click below — Google will prompt you to copy it into your own Drive.
Make a copy of the templatePublish the sheet for the web map
The web map reads a published CSV URL. To create one:
- 1. Open your copy of the Sheet.
- 2. Go to File → Share → Publish to web.
- 3. Select Comma-separated values (.csv) as the format.
- 4. Click Publish and copy the URL.
Step 2 — Set up your automation workflow
The workflow is simple — it receives each webhook from FlowTrigger and writes one row to Google Sheets.
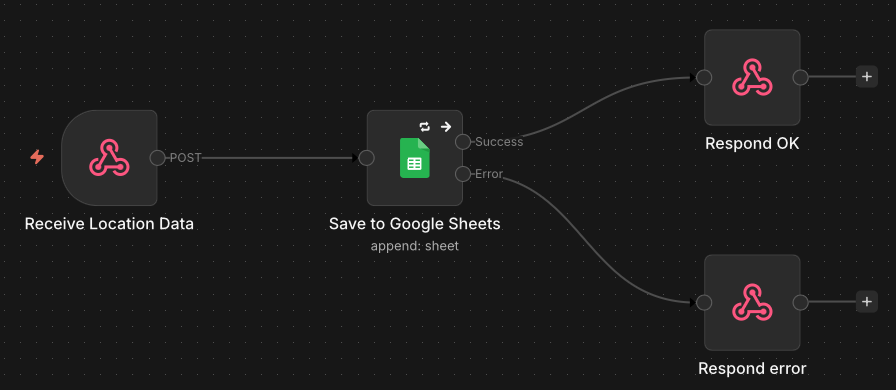
Download one of the ready-made templates below and import it into your platform. n8n and Make are covered out of the box; any tool that accepts an HTTP POST and writes to Google Sheets will work the same way — Zapier, Pipedream, custom code.
Make
Scenario blueprint
Open official Make website and click Use this scenario.
Open Make blueprintIn the Google Sheets node, select the same Sheet you copied in Step 1 and authenticate your Google account. If you need help connecting Google Sheets, check the official guides:
- n8n — walkthrough video from the official n8n YouTube channel. Watch video
- Make — Google Sheets app documentation. Read docs
Once the workflow is running, each GPS event from FlowTrigger appends one row to your Sheet. The web map reads the Sheet's published CSV URL and renders your routes, geofence zones, and location markers.
Step 3 — Configure the location trigger on Android
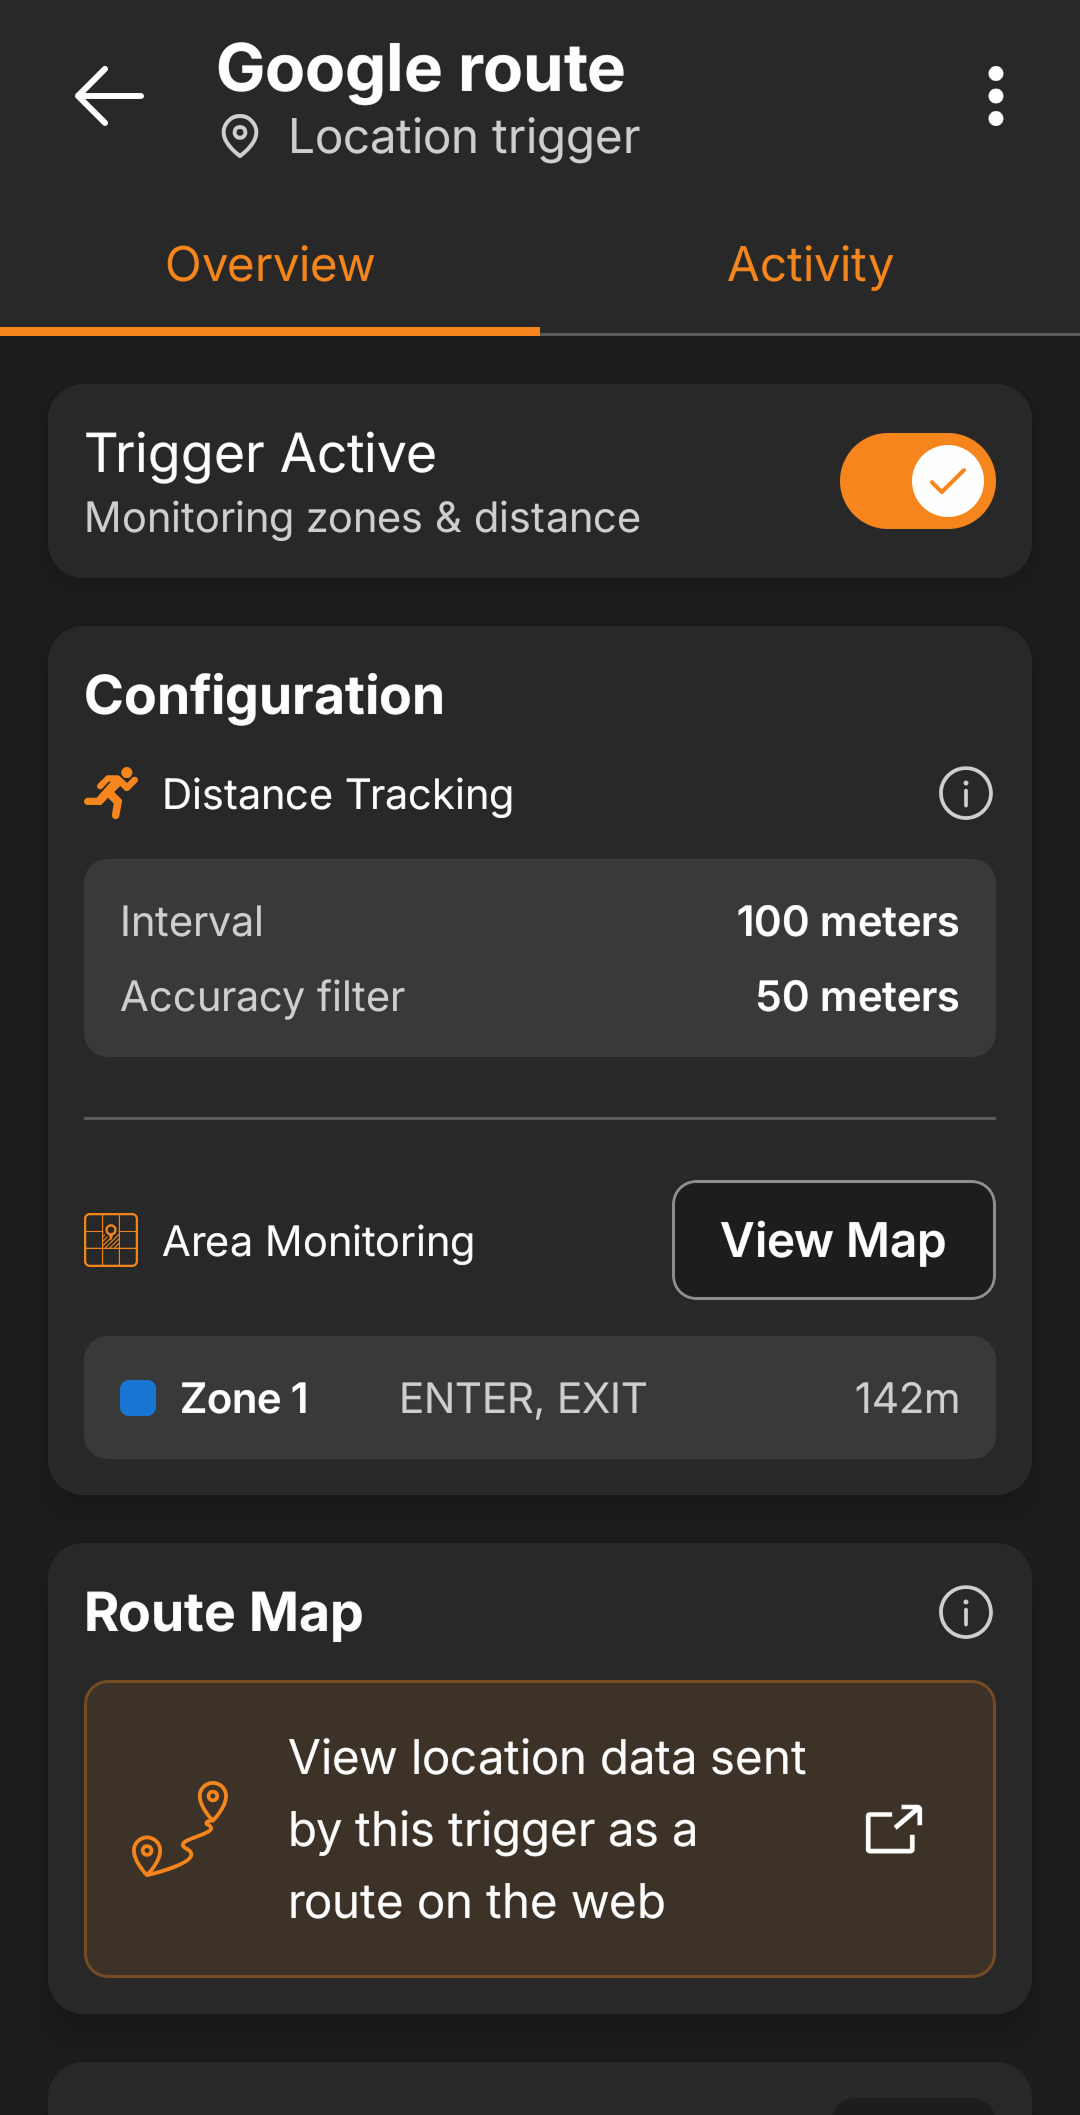
Open FlowTrigger on your phone, create a new Location trigger, and pick a tracking mode. Both modes can run on the same trigger.
- Distance-based — fires every X meters travelled (minimum 50 m). Good for routes, commutes, fitness, or fleet tracking.
- Area-based (geofences) — fires on ENTER or EXIT for up to 10 named zones. Good for arrival / departure events and time-at-location tracking.
- Background & offline — runs without the app open; cached requests resend automatically when connectivity returns.
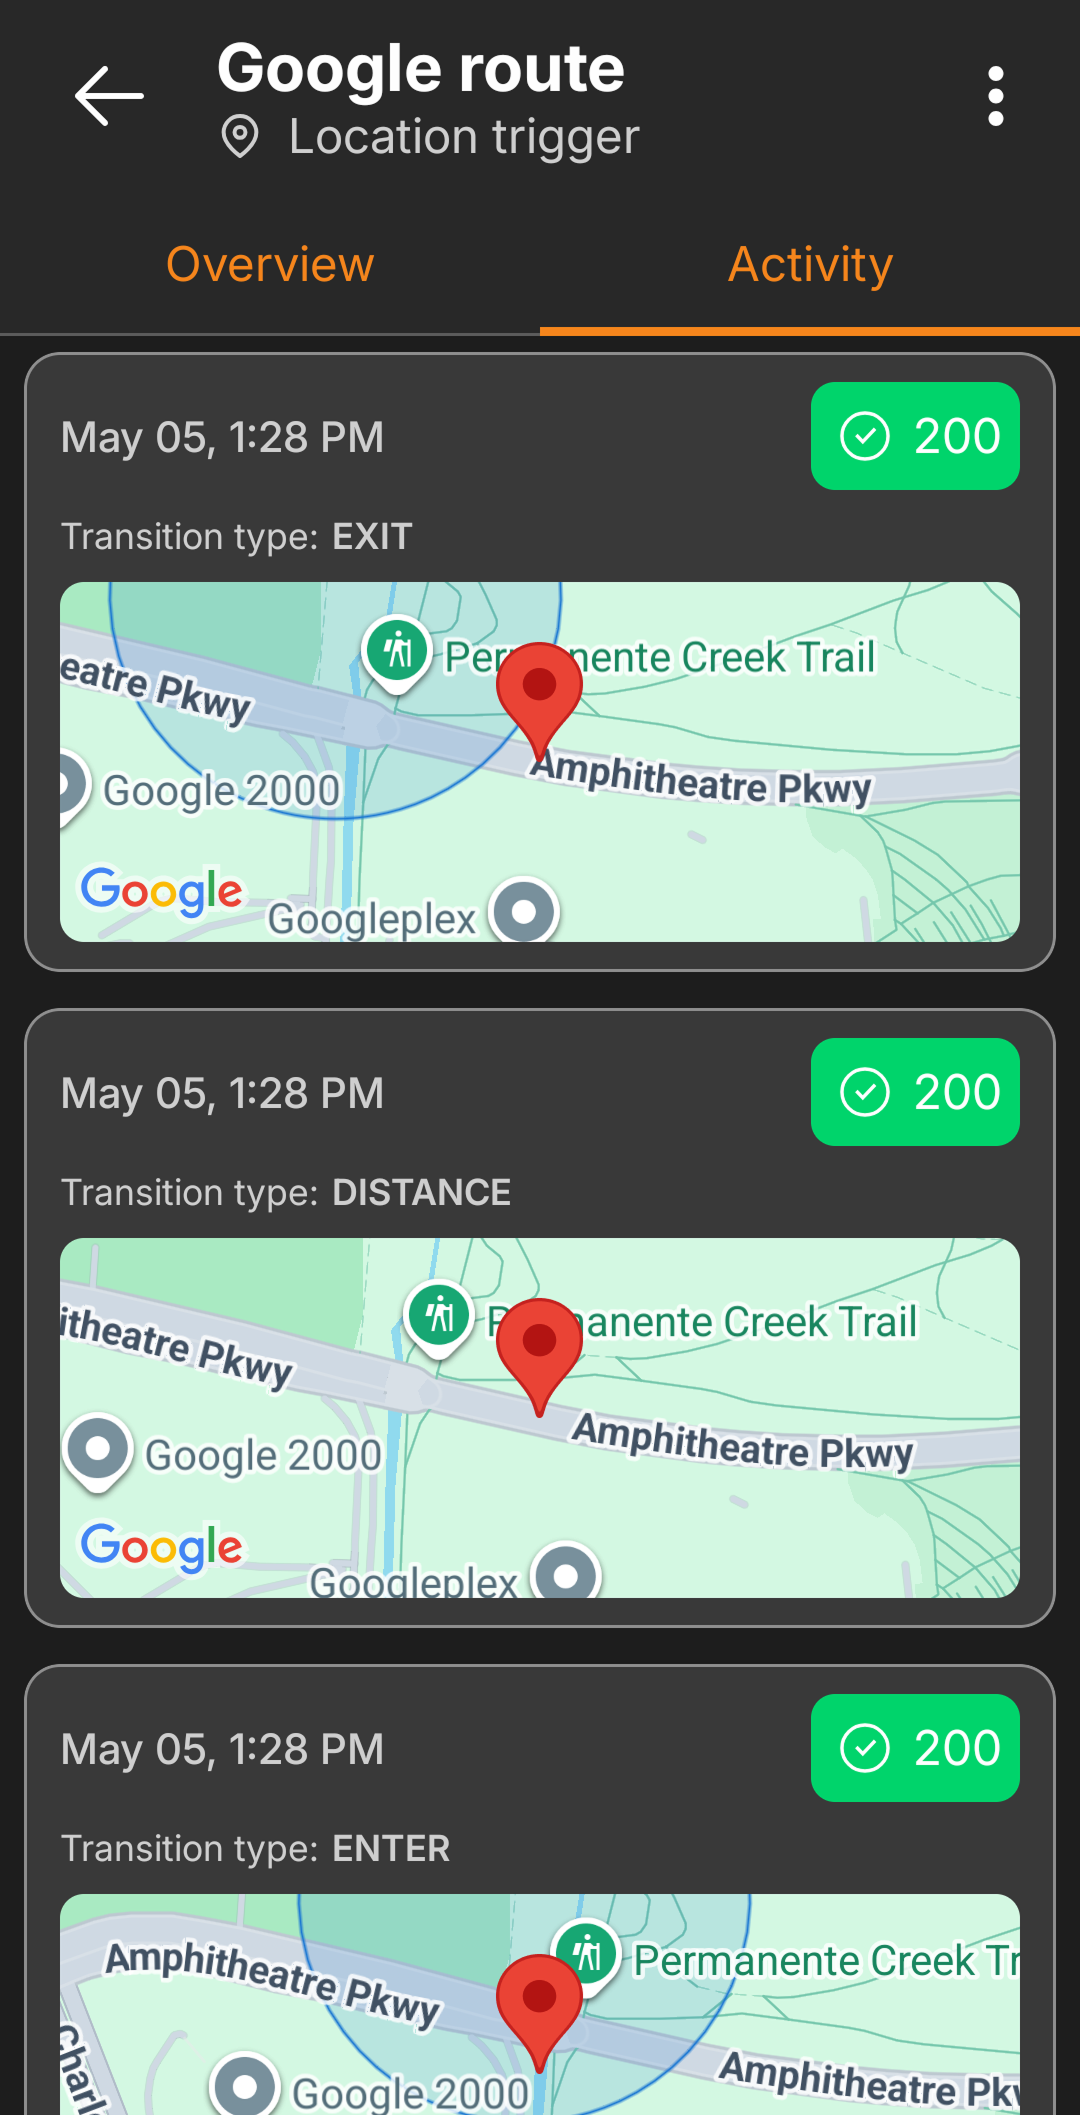
Send a test event from the trigger detail screen — your automation receives one webhook with the real payload shape, which makes mapping fields to Google Sheets columns much easier.
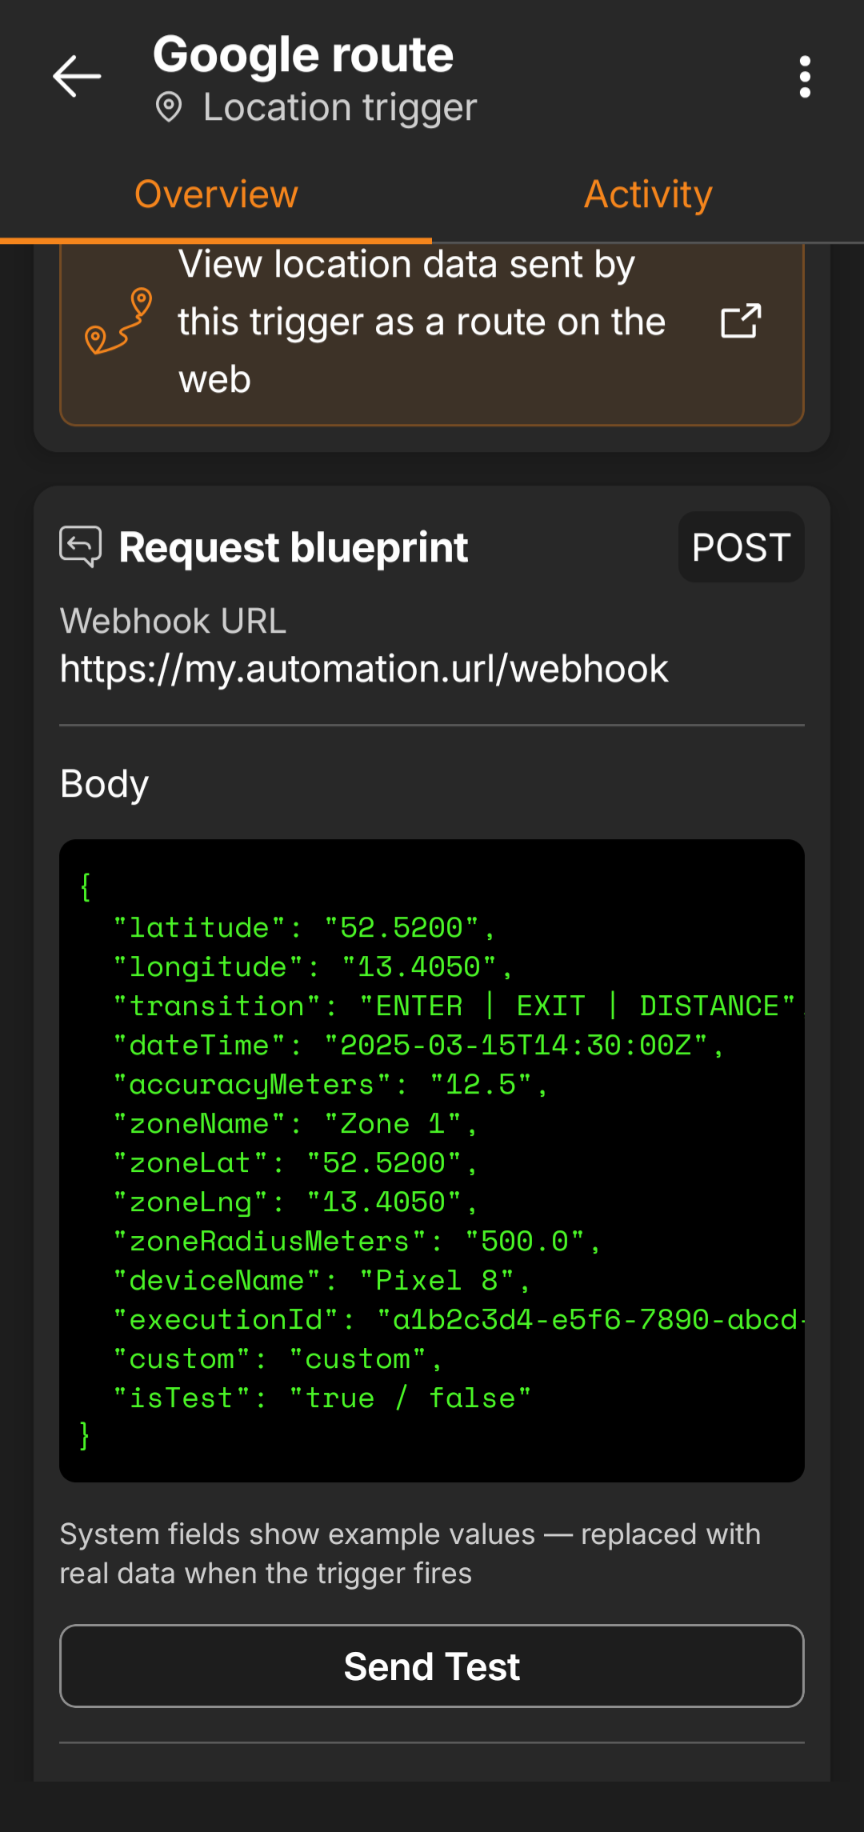
For the full webhook payload, field reference, and customization options, see the Location Trigger documentation.
Step 4 — Visualize routes on the web map
Open flowtrigger.app/map and paste your published CSV URL. The map draws every row in your Sheet — no signup, no upload, no waiting.
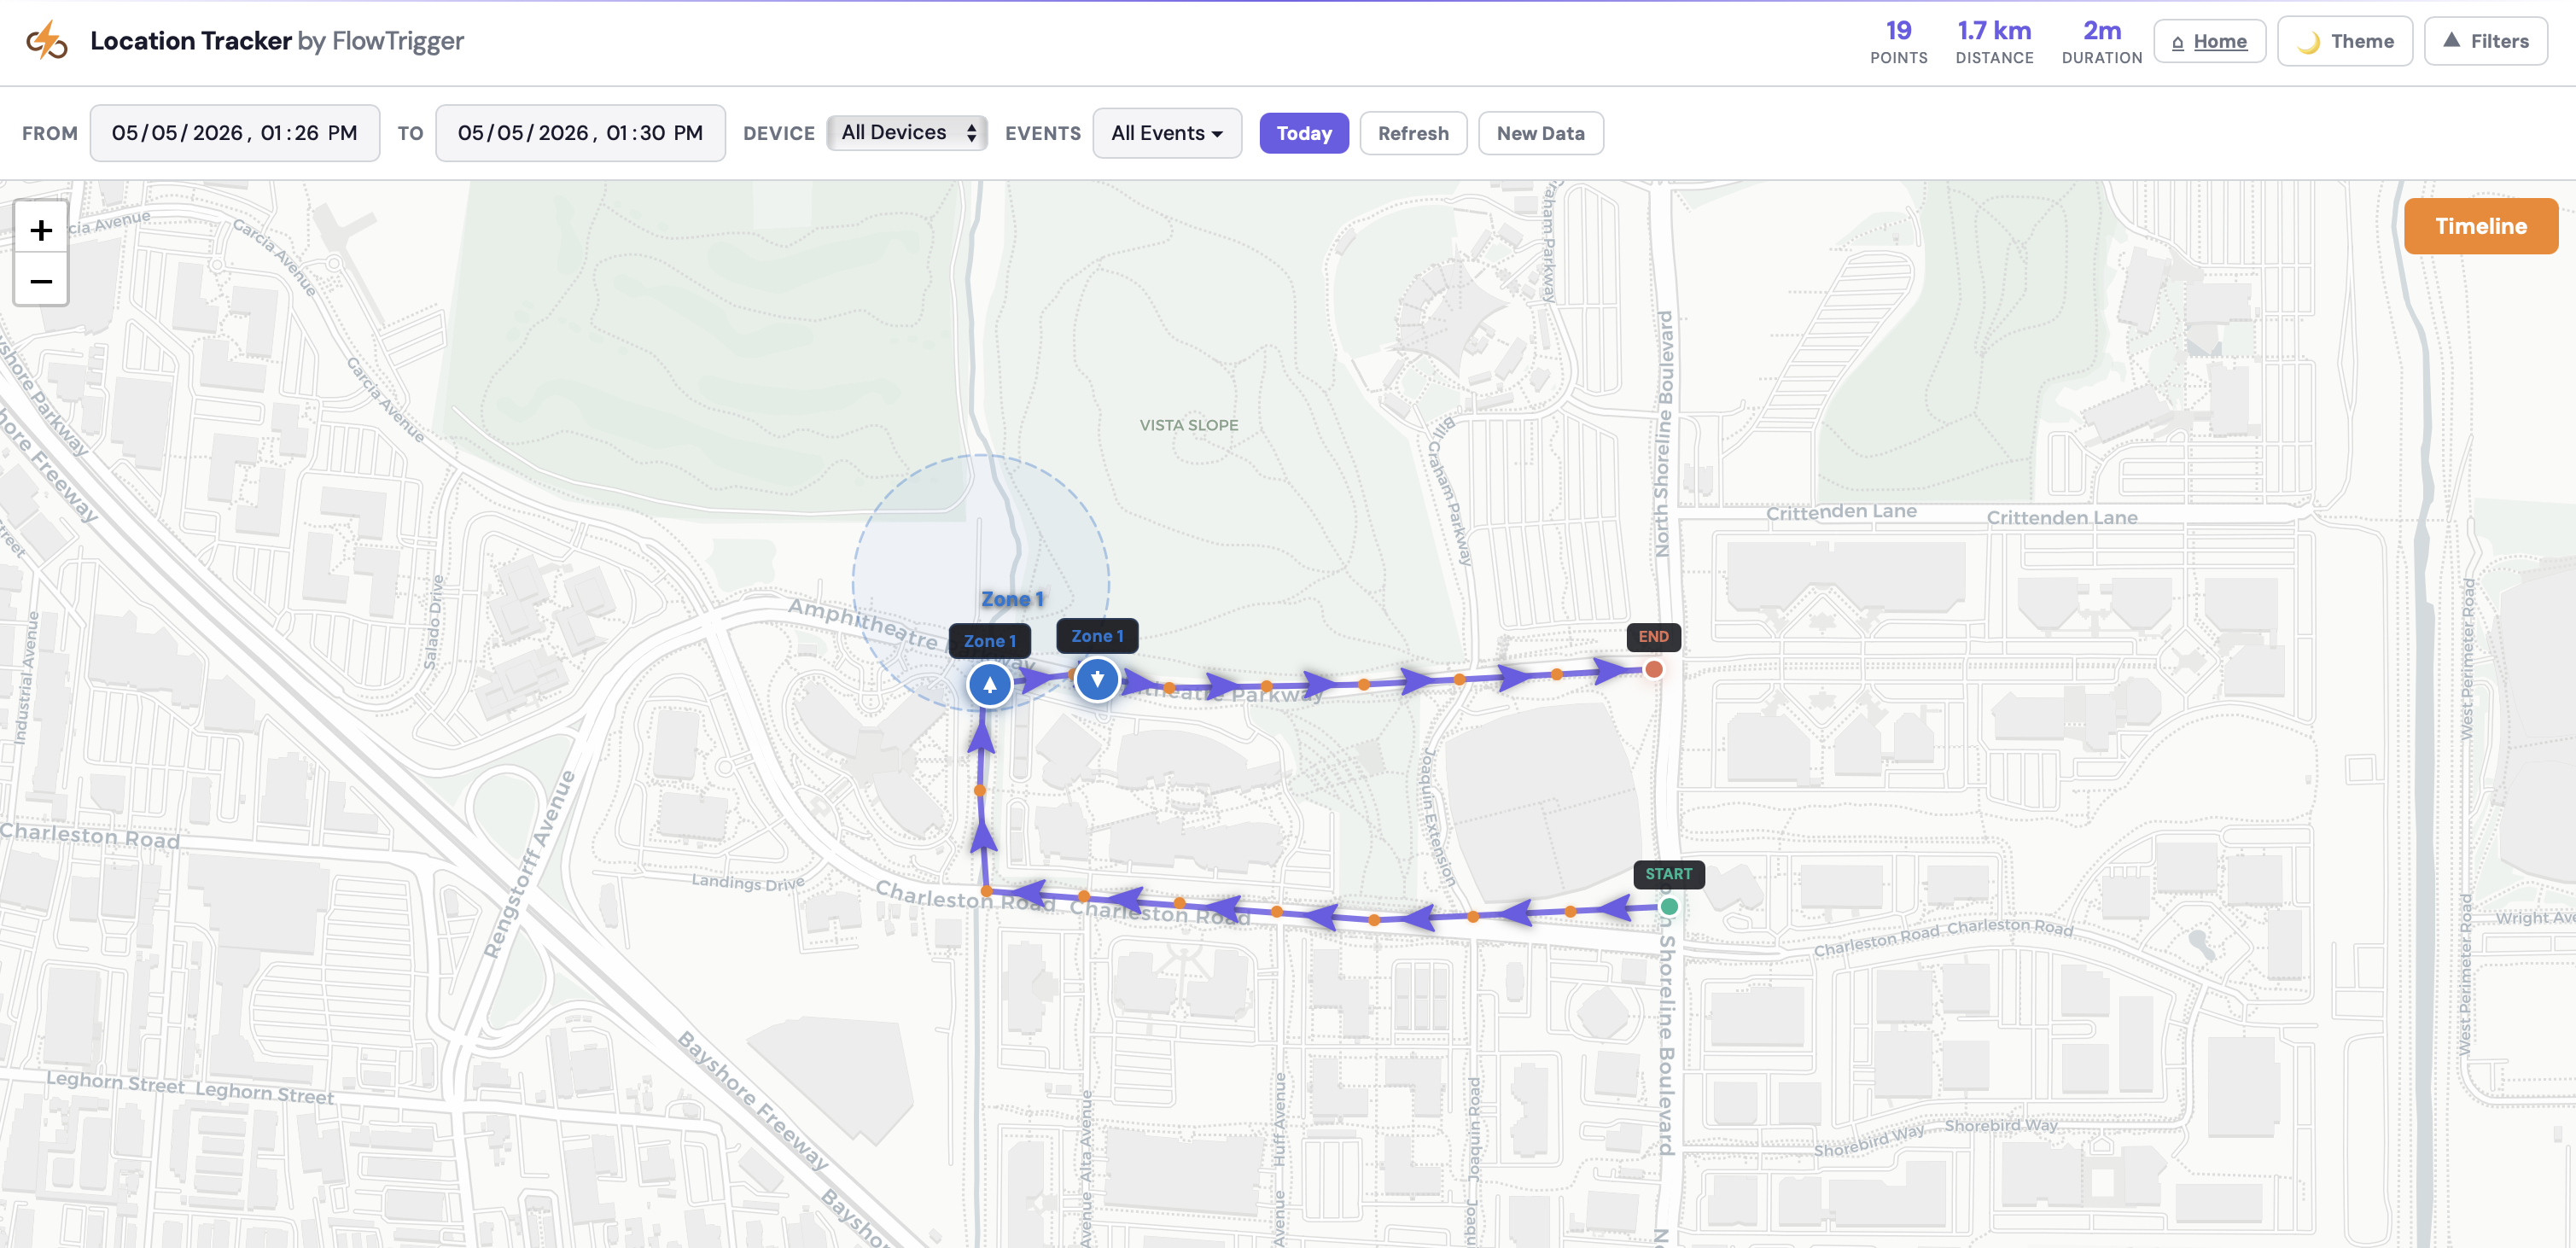
Features:
- Route polylines — every DISTANCE event in your Sheet, connected in order, with directional arrows.
- Geofence zones — ENTER and EXIT rows draw the matching zone circle, labelled with its name.
- Multi-device support — each
deviceNamegets its own colour, with a legend you can toggle. - Filterable timeline — filter by date or event type (DISTANCE / ENTER / EXIT) and the map updates instantly.
- Light & dark themes — Choose what works best for you.
Where your data goes
The map page runs entirely in your browser. FlowTrigger has no backend that sees, stores, or proxies your CSV — your browser fetches the URL directly from Google Sheets. The URL itself is your "Publish to web" link, so treat it like any unlisted Google document: anyone with the URL can read it, and you can stop sharing at any time from File → Share → Publish to web → Stop publishing.
Start tracking locations today
Download FlowTrigger, set up a location trigger, import a workflow, and watch your GPS data land on the map in minutes.